
Rocketing! Pig prices rebound “retaliatorily”—but is the momentum fading?
As time goes by, 11 is moving into its middle and latter part. In China’s livestock and poultry farming sector, the live pig market is seeing a “little spring,” with pig prices rebounding after being “oversold.” However, looking at the situation rationally, this recovery from the bottom is still mainly a bottoming-out adjustment. Although there are signs of a seasonal turning point in pig prices, pressure from the supply side should not be underestimated. In my view, pig prices may remain volatile but firm in the middle and latter part of 11. Changes in the pace of sales by large pig farming companies may occasionally put the market under pressure to pull back. The analysis is as follows:
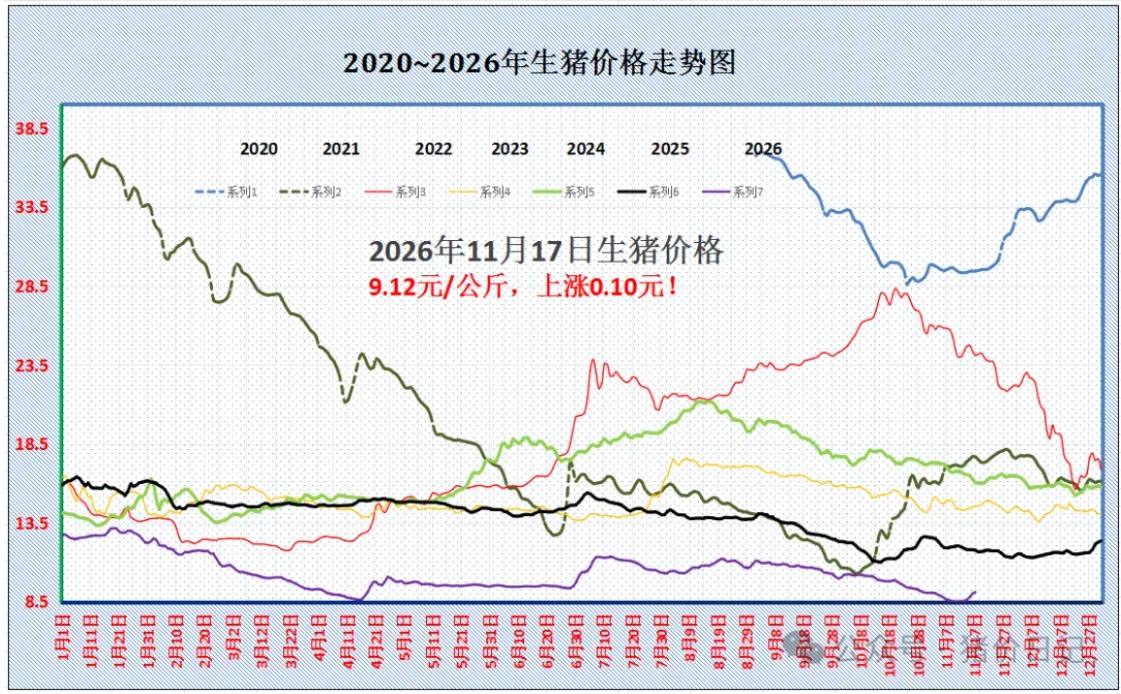
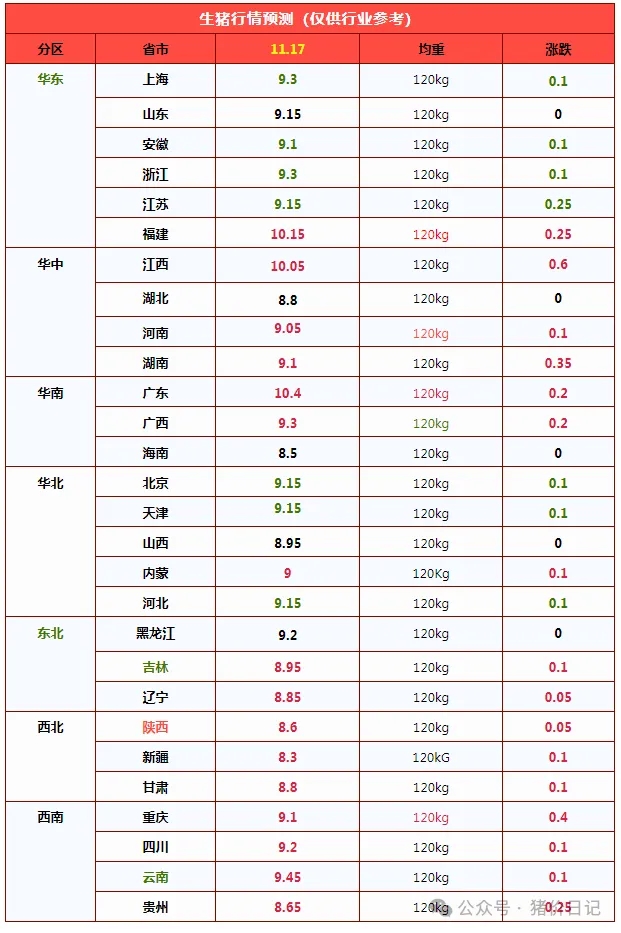
In-depth assessment of the sales volume and capacity cycle of 21 listed hog companies in 2026 year 10 month
Abstract: In 2026 year 10 month, market hog sales by 21 sampled listed pig farming companies fell 14.63% year over year, marking the largest single-month contraction of the year. The reduction was highly concentrated among four leading companies: Muyuan, Wens, New Hope, and Tech-Bank Food. This marks a shift in this round of capacity reduction from the historically prevalent pattern of small and medium-sized independent farmers being forced out to proactive herd management by large-scale leaders. Sow inventories continue to fall below the regulatory benchmark, but the biological lag of about 10 months in pig breeding means that the window for a material supply contraction will not arrive until after the second quarter of 2027 year. The fourth quarter of 2026 year through the first quarter of 2027 year will remain within a supply-inertia period shaped by existing finishing hogs, large hogs held back from sale, and frozen-product inventories. The industry has entered a phase of systemic losses. Price spikes are catalyzed by seasonal cured-meat demand and government purchases for stockpiling, but a sustained trend reversal requires confirmation from two signals: “continued reductions in sow inventories + year-over-year declines in cumulative sample sales.” The industry’s competitive paradigm is shifting from scale expansion to competition over cost curves, cash flow, and balance-sheet resilience.
First, market-ready supply: the monthly marginal change turned negative, with destocking unevenly distributed and leading producers accounting for the vast majority of the reduction.
A total of 21 listed pig farming companies marketed 1566.97 ten thousand commercial pigs in 2026-10, a year-on-year decrease of 268.57 ten thousand head, or 14.63%. This was the largest year-on-year decline in a single month in 2026. A breakdown by structure shows that this supply contraction was highly concentrated among leading companies: Muyuan Foods, Wens Foodstuff, New Hope, and Tech-Bank Food jointly marketed 1127.05 ten thousand head, a year-on-year decrease of approximately 207 ten thousand head, accounting for 77% of the total reduction in the sample. In other words, the marginal supply contraction in this round was not the cumulative result of natural attrition among dispersed market participants, but a concentrated reflection of leading companies at the far left of the industry cost curve proactively implementing capacity adjustments.
Table 1 Monthly Slaughter Breakdown for the Four Leading Companies 10
|
Enterprise |
10 monthly market hogs (ten thousand head) |
Year-on-year reduction (ten thousand head) |
Note |
|
Muyuan Foods |
591.30 |
- |
The four leading players' combined reduction contribution accounts for 77% of the sample's total reduction. |
|
Wens Foodstuff Group |
352.72 |
- |
|
|
New Hope |
128.69 |
- |
|
|
Tianbang Food |
54.34 |
- |
|
|
Total |
1127.05 |
-207.00 |
Accounts for 77% of the total sample reduction |
Significant divergence within the sample: of 21 companies, 12 recorded a year-on-year decline in hog sales, while 9 maintained positive growth. Among the top five by sales volume, only Zhengbang Technology expanded its hog sales. The companies reducing sales were clearly divided into tiers: among the 12 companies with year-on-year declines, 7 saw declines of more than 20%, accounting for 58.3% of the companies reducing sales. Among them, Jinxinnong sold 7.58 ten thousand head, down 53.02% year on year—the steepest decline in the sample. The broad-based and substantial concurrent reductions point to deliberate herd-level cutbacks, distinct from short-term technical fluctuations caused by adjustments to sales timing or mismatches between batches.
Table 2 overview of sample variation at market release
|
Category |
Number of enterprises |
Core Features |
Representative entity |
|
Year-on-year decline in animals shipped |
12 households |
7 companies with a decline of more than 20%, mainly due to proactive production cuts |
Jinxinnong (-53.02%), Muyuan, Wens, New Hope, Tech-Bank Food |
|
Year-on-year growth in livestock marketed |
9 households |
The base is low and it is in an expansion cycle |
正虹科技 (+142.52%), 正邦科技, 神农集团, 天康生物, 傲农生物, 立华股份, 罗牛山, 克明食品, 天域生物 |
The offsetting side comes from a group of mid-sized companies with a low starting base that are in an expansion cycle. At the industry level, consensus has formed around capacity reduction, but companies make different choices based on their own debt structures, cash reserves, and long-term market share strategies. This supply-side offset is also the core factor preventing a further increase in the decline in the total sample.
Cumulative comparison of sample animals shipped for table 3
|
Metric |
Numerical value |
Year-on-year change |
Year-on-year increase |
|
10 monthly slaughter |
1566.97 ten thousand head |
-268.57 ten thousand heads |
-14.63% |
|
Cumulative number of animals shipped from 1–10 months |
1.57 hundred million head |
+308.80 ten thousand head |
+2.01% |
The conflict between marginal signals and stock constraints is the foremost consideration in current supply analysis: a negative year-on-year figure for a single month only indicates a marginal slowdown in the growth rate of supply, while the cumulative total supply for the year remains on an expansion trajectory. Fattening pigs already on farms as a result of earlier capacity releases, positions in secondary fattening, and large pigs whose marketings have been delayed through retention together form a hidden supply reservoir. Within the cycle analysis framework, the year-on-year figure for a single month is a marginal indicator, while the cumulative year-on-year figure is the core observation indicator of stock supply pressure; a contraction in marketings in a single month alone is insufficient to determine a supply turning point.
II. Price-cost matrix: Systemic losses across the industry have taken hold, and price recovery lags capacity adjustments
Proactive production controls have been implemented at the farm-gate level, but there is a clear lag in the transmission of supply adjustments to prices. In 10 month, the price midpoint for domestic and imported three-way crossbred pigs continued to decline. At the monitoring point, the average price for three-way crossbred pigs was 4.24 yuan/jin (8.48 yuan/kg). A modest short-term rebound did not reverse the downward trend, and the price floor was tested repeatedly in the second half of the year.
Table 4 Summary of Live Pig Selling Prices and Costs (yuan/jin)
|
Indicator |
Numerical value |
Month-on-month change |
Description |
|
17 sampled enterprises’ 9 monthly average price |
5.34 |
- |
|
|
17 sample companies' 10 monthly average price |
4.94 |
-0.40 |
Month-on-month decrease of 7.50% |
|
Average full cost of sample publicly listed pig companies |
6.14 |
- |
Break-even benchmark line |
|
Inverted price differential |
-1.20 |
- |
At a shipping weight of 120 kg, the static loss per head is approximately 288 yuan |
The selling price tiers directly map to the distribution of loss structures: Table 5 Distribution of monthly selling price ranges for sampled enterprises in 10
|
Price range (yuan/jin) |
Number of enterprises |
Share of companies reporting the average price |
Company list |
|
<5.0 |
11 households |
64.7% |
- |
|
5.0–5.4 |
3 companies |
17.6% |
- |
|
5.4–5.9 |
3 companies |
17.6% |
Dongrui Co., Ltd., Jinxinnong, Jingji Zhino |
The premium earned by higher-priced producers is mainly attributable to regional price differentials in sales markets, breeding-stock structure, and in-house slaughtering facilities. This premium serves as a buffer but cannot by itself provide a sufficient margin of safety for profitability. Rigid costs are the underlying constraint driving industry losses. Combined with the sunk costs of piglets purchased externally at high prices earlier and ongoing finance charges, actual cash-flow losses for companies on the right side of the cost curve exceed the amounts indicated by book-based estimates. The cost-tier effect is significant: leading companies use herd efficiency, centralized feed procurement, and internal supporting operations to keep losses within a manageable range; high-cost, highly leveraged producers continue to consume operating cash flow, and losses are evolving from individual business risks into systemic pressure across the industry.
Demand lacks an effective offset. High-frequency slaughter data from SCI show that in 10 month, the average daily slaughter volume of large-scale slaughtering enterprises fell year over year, while frozen-product inventory capacity utilization remained high. Slaughtering businesses focused mainly on working through earlier inventories and showed little willingness to proactively build stocks at lower prices. The southern cured-meat season entered its warm-up phase only in the latter half of 10 month, with the substantial demand-pull window concentrated in the middle to latter part of 11 month. Historical comparisons also show that demand elasticity during this peak cured-meat season is weaker than in previous cycles. The supply-strong, demand-weak imbalance was not corrected in 10 month despite reduced marketings, which is the core reason for the delayed price adjustment.
Three. Production capacity transmission logic: the decline in breeding sow numbers is accelerating, and biological time lags define the cycle timeline
This round of capacity reduction is driven by two factors: the long-term regulatory mechanism for hog production capacity is guiding leading producers to reduce herd sizes in an orderly manner, while sustained and deep losses are forcing companies to proactively cull low-efficiency breeding sows, optimize herd structure, and manage the pace of fattening hog shipments. The combined effect of policy guidance and market-driven exits is shifting the pattern of this round of capacity reduction: from small-scale farmers passively clearing their herds at the bottom of previous cycles to large-scale leading farms proactively controlling herd sizes.
Table 6 National Breeding Sow Inventory Data
|
Metrics |
Numerical value |
Year-on-year change |
Month-on-month change |
Compare with the control benchmark (3750 ten thousand head) |
|
Breeding sow inventory at the end of the third quarter |
3602 ten thousand head |
-10.7% |
-4.7% |
Low 148 ten thousand head, relatively low 3.9% |
|
10 monthly Mysteel high-frequency sample |
- |
- |
-1.57% |
Month-on-month sell-through for 9 consecutive months |
The hog breeding chain has a fixed biological lag of approximately 10 months: the decline in market hogs currently observed corresponds to sow culling at the end of 2025 and the beginning of 2026; the accelerated capacity reduction initiated in the third quarter of 2026 will be transmitted to a material decline in market hog supply, with the time window falling after the second quarter of 2027. This lag is a hard constraint on cycle assessment: from the fourth quarter of 2026 through the first quarter of 2027, the industry will remain in a supply-inertia cycle driven by the release of capacity from the previous period. Combined with the seasonal consumption slump, the price center is more likely to move down than up.
Differences in the types of operators exiting the market are prolonging this round of bottoming-out volatility: small and medium-sized individual operators have fragile funding chains; once their cash flow is exhausted, they clear out quickly, with low sunk costs of exit. Large listed operators have a wider range of financing tools and ample room to maneuver their balance sheets, making the marginal cost of exiting the market significantly higher and the pace of clearance inherently slower. Combined with some medium-sized businesses expanding production counter to the trend, industry clearance is a slow, uneven process, prolonging the bottoming-out period.
Four: Framework for Breaking Down Drivers and Assessing Cycle Turning Points
Table 7 Market Driver Factor Matrix
|
Direction |
Core factors |
Transmission pathway |
Constraints |
|
Lido |
Active production cuts by leading companies are being implemented, and the number of breeding sows continues to decline. |
Contraction in the medium- to long-term supply of market hogs |
Can destocking continue without a concentrated restocking? |
|
Benefits |
Peak season for cured meat; reserve meat procurement and storage |
Short-term demand pickup stimulates a price pulse |
Frozen-product inventories are weighing on the market, demand elasticity is relatively weak, and the rebound has limited upside. |
|
Advantages |
Continued losses are accelerating the exit of inefficient production capacity |
Industry cost curve optimization, with a higher long-term earnings baseline |
Listed companies have strong financing resilience, and the pace of market clearance is relatively slow |
|
Bearish |
Cumulative livestock sales increased year-on-year, with delayed slaughter, secondary fattening, and high frozen-product inventories |
Continued release of existing supply is putting downward pressure on prices |
A single month's reduction is difficult to quickly absorb the existing supply pool |
|
Negative |
End-user consumption remains inherently weak, and slaughterhouses are cautious about replenishing stocks |
Demand lacks sustained momentum |
The boost from cured and preserved foods is only temporary and intermittent. |
|
Bearish |
Industry-wide full costs are inflexible |
A slight price rebound is unlikely to restore profitability |
Profit recovery lags behind price increases |
Short-term view (2026 year 11 month-2027 first quarter): The market is forming a bottom within a range; the pulse does not form a trend
Cured meat consumption and reserve stockpiling are expected to bring a temporary price rebound, but this is a seasonal pulse in the market. Constrained by high frozen-product inventories and insufficient demand elasticity, the rebound has limited upside. When prices rise to around the breakeven point for businesses, large-scale farms will flexibly adjust their marketing pace to release supply, suppressing a sustained upward price trend. The market’s overall tone is low-level range-bound fluctuation.
Dual-validation framework for mid-cycle turning points
Table 8: Dual-signal system for confirming cycle turning points
|
Observed signal |
Evaluation Criteria |
Signal meaning |
|
Signal one: Breeding sow inventory |
Declining month over month, with no concentrated restocking in the first quarter of 2027 and inventories not turning positive |
The logic of medium- to long-term supply contraction remains unchanged; if prices stop falling and rebound, the turning point will be delayed |
|
Signal two: cumulative number of samples shipped |
21 listed pig farming companies’ cumulative sales volume shifted from year-on-year growth to decline |
Pressure from existing supply has eased substantially |
Only when both signals resonate is there a basis for confirming a cyclical bottom; a year-on-year decline in monthly marketings is merely a signal of marginal improvement and cannot serve as the criterion for determining a trend reversal.
Enterprise Competition Paradigm Shift
The industry's main competitive focus has shifted: away from the previous race to increase the number of animals shipped and expand capacity, and toward cost-curve management, operating cash flow security, improved herd PSY efficiency, and balance-sheet risk control. Entities with high debt, high total costs, and relatively low herd efficiency will remain under pressure through a prolonged trough, with rising risk of being forced out of the market; leading companies with stable cash flow and costs at the industry's forefront will continue to gain market share during the low-price cycle.
The cyclical outlook has already been priced in by the market, but earnings recovery is a slow-moving variable. The key anchors for future monitoring are the persistence of the decline in the breeding sow herd, the pace of frozen product inventory reduction, and marginal changes in end-consumer demand. Short-term fluctuations in monthly slaughter data will not change the supply timeline determined by the biological cycle.
National live pig prices hit a new low for the year! 10
According to the latest national wholesale price monitoring data, in 11 month, the national average wholesale price of pork was 14.81 yuan per kilogram, and the price of live pigs has hit a nearly ten-year low.
According to Xinwenfang, many netizens have been asking over the past few days: What’s going on with pork prices? Is pork already cheaper than vegetables? Did they read the prices wrong?
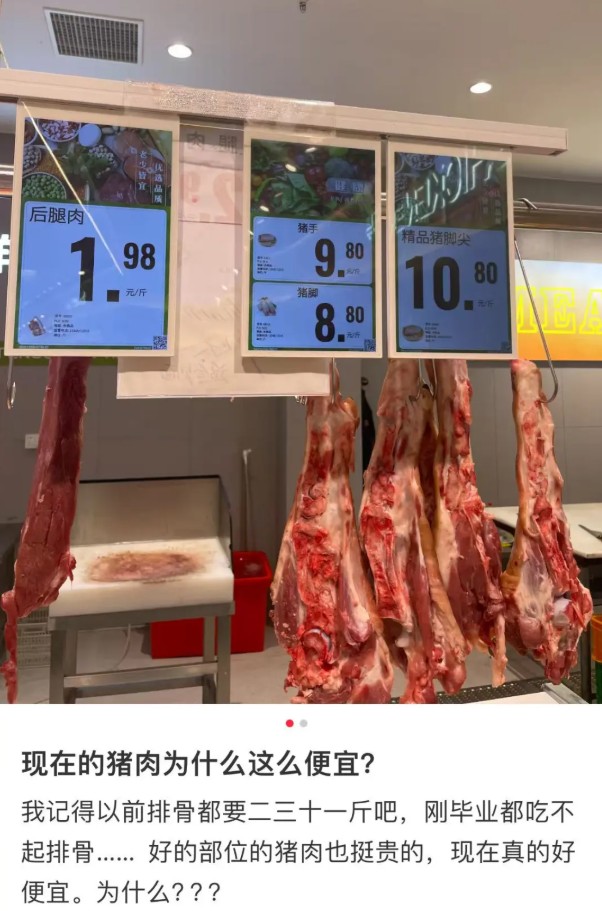
“Eggs cost 4.3 yuan, while pork costs only 4.9 yuan. Is this price correct?”Ms. Lin, shopping for groceries at the market, picked up a piece of pork and exclaimed, “Pork is so cheap now.”
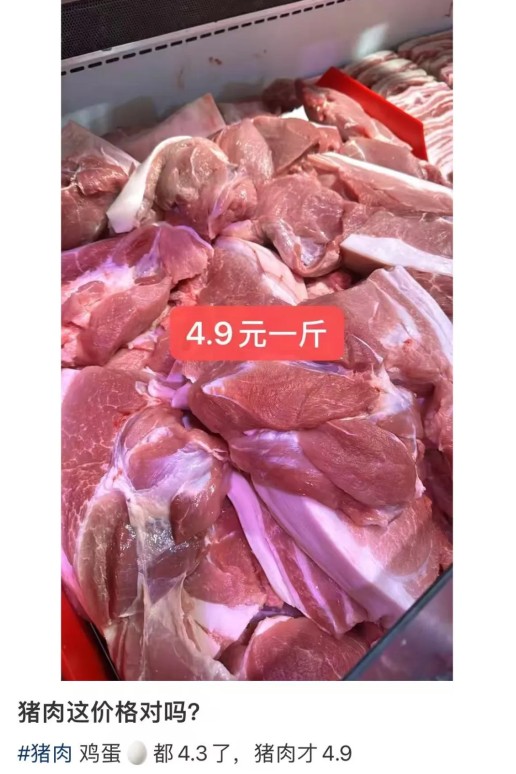
Image source: Xiaohongshu
According to the latest national wholesale price monitoring data,In month 11, the national average wholesale price of pork was 14.81 yuan per kilogram, and live hog prices had reached a nearly ten-year low.
Pork prices have fallen to a nearly 10-year lowHema, Sam's Club, Dingdong, and Yonghui are all cutting prices
A reporter visiting a market found that some pork prices were already significantly lower than vegetable prices. Take a bowl of pork and green peppers, for example: 5 yuan buys a piece of lean pork bigger than a fist, while green peppers cost 5 yuan per jin.
The regular pork market is sluggish. The wholesale price of pork carcasses is less than 6 yuan per jin. Whether at Hema, Dingdong, Yonghui or Sam's Club, pork prices at fresh-food supermarkets have also fallen noticeably, with some even seeming “cheaper than at the wet market.”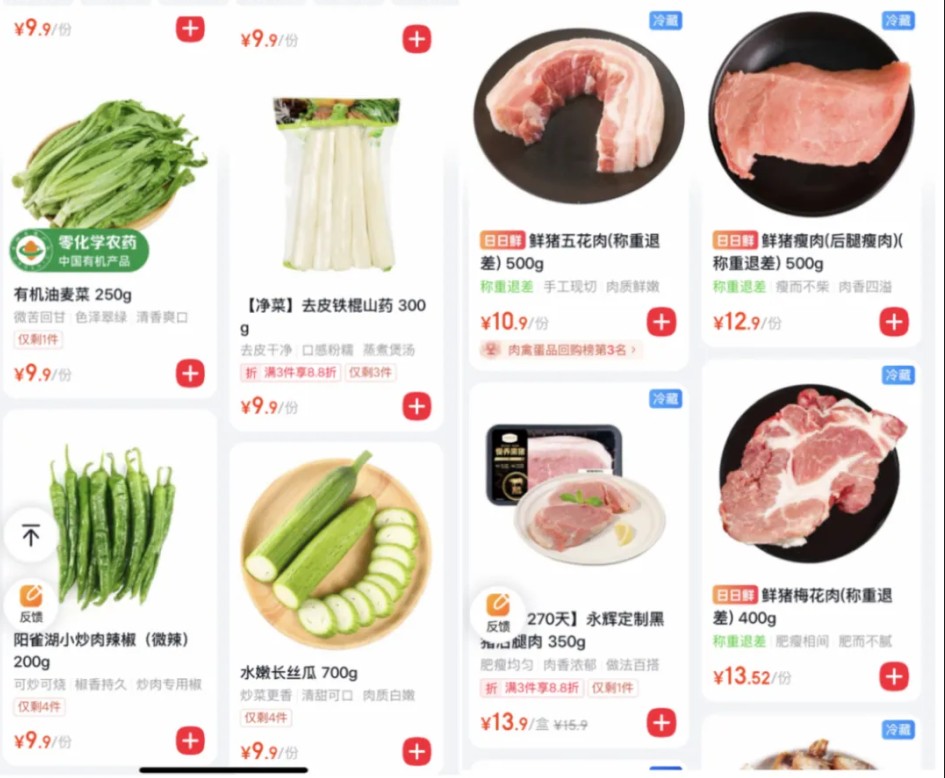
E-commerce platform screenshot
The regular pork market is sluggish, with wholesale prices for pork carcasses below 6 yuan per jin, at a cyclical low. Prices for branded pork and black pork have also fallen in response.
Whether it’s Hema, Dingdong, Yonghui, or Sam’s Club, pork at fresh food supermarkets has also become noticeably cheaper. Some people even feel it’s “cheaper than at the wet market.”
According to a report by Yicai,On 11/9, the national average price for non-native three-way crossbred pigs was 8.63 yuan/kg, setting a new low for this year and the lowest domestic hog price in nearly 10 years. The previous low was 8.77 yuan/kg in mid-4 this year.
Looking back on the year, after hitting bottom in mid-4, hog prices moved sideways around 9 to 10 yuan/kg in 5 and 6. They rebounded in 7, and the peak for Three-Yuan hogs within 7 to 8 rose above 11.5 yuan/kg. Prices have fallen again since the end of 8; instead of rising, they declined after the National Day holiday.
Leading hog farming companies collectively reported losses. Muyuan Foods' revenue for the first three quarters was 922.00 billion yuan, down 17.52% year on year, with a net loss attributable to shareholders of the parent company of 93.19 billion yuan. Wens Foodstuff Group (300498.SZ) recorded revenue of 721.97 billion yuan, down 4.74%, and a loss of 49.61 billion yuan. New Hope (000876.SZ) recorded revenue of 876.98 billion yuan, up 8.94%, and a loss of 25.68 billion yuan. The three companies' combined losses totaled 168.48 billion yuan. Among smaller-cap hog farming companies, TIAN BANG FOOD (002124.SZ), Juxing Agriculture and Animal Husbandry (603477.SH), ZHENG BANG TECHNOLOGY (002157.SZ), and New Wufeng (600975.SH) were all reporting losses to varying degrees.
Regarding hog prices in the fourth quarter and beyond, institutions are generally neutral to cautiously optimistic, but differ on the timing and extent of a rebound. CITIC Futures notes that market hogs will remain in high supply in the fourth quarter, with the supply inflection point expected to gradually materialize at the end of 2026. Supply pressure from hog shipments will ease in 2027, and the cycle will bottom out and recover. Guotai Junan Securities cautions that a hog price rebound over the next 6 to 8 months may still lack momentum, and losses may persist; current share prices mainly reflect expectations of capacity reduction.