
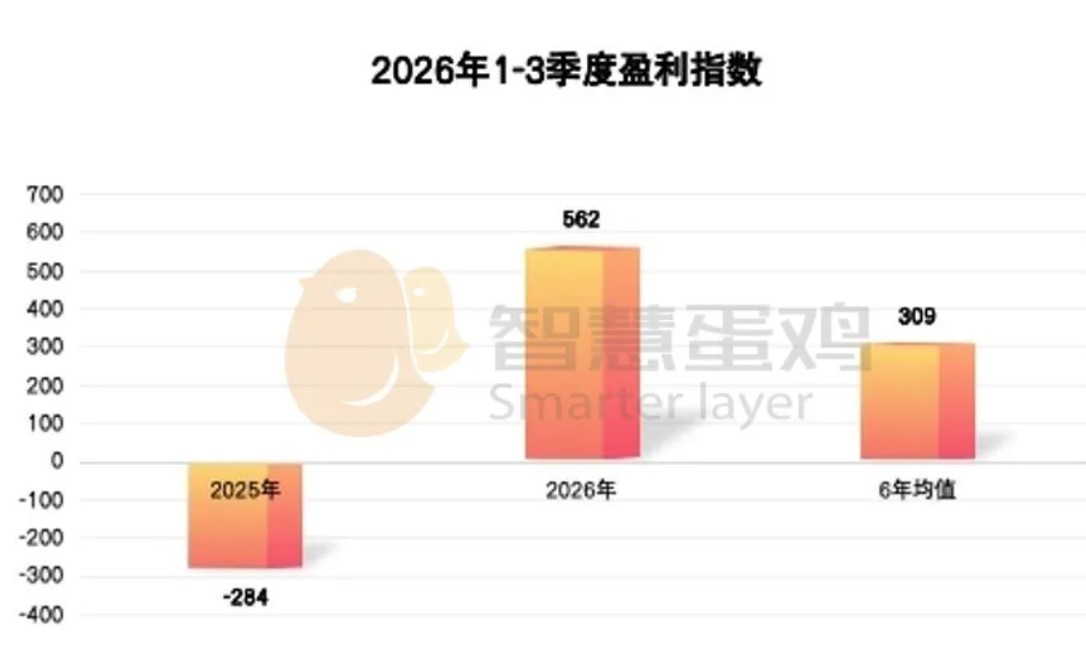
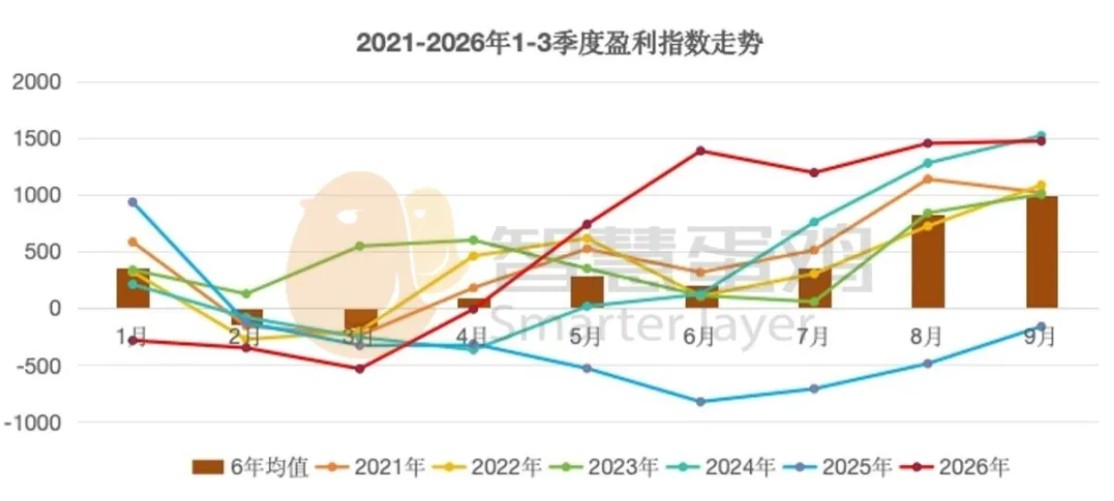
2026year1-3quarter, the domestic layer market fluctuated sharply, with overall profitability reversing from deep losses to high profits. Data show that,1-3The lowest monthly profitability for quarterly laying hen farming fell to -535 points (3month), putting the industry in a state of deep losses; the highest monthly profitability rose to 1472 points (9 month), reaching a record high in profitability 2021the highest level for the same period since the beginning of the year;1-9monthly average profit 562 points, compared with 2025 year-on-year average (-284 points), achieving a turnaround from loss to profit.
This report reviews market operating data for the first three quarters, analyzes the core causes of significant market fluctuations from the perspectives of supply, costs, demand, and industry cycles, and, in conjunction with herd structure, restocking pace, and seasonal consumption patterns, examines the 2026 year, the 4 quarter and 2026Assess the overall trends in the layer hen market for the year, providing a reference for production and business operations across the entire industry chain and for market decisions.
Part one: Analysis of the current state of the layer hen market
One: Analysis of the egg price index
1Year-on-year analysis of the egg price index
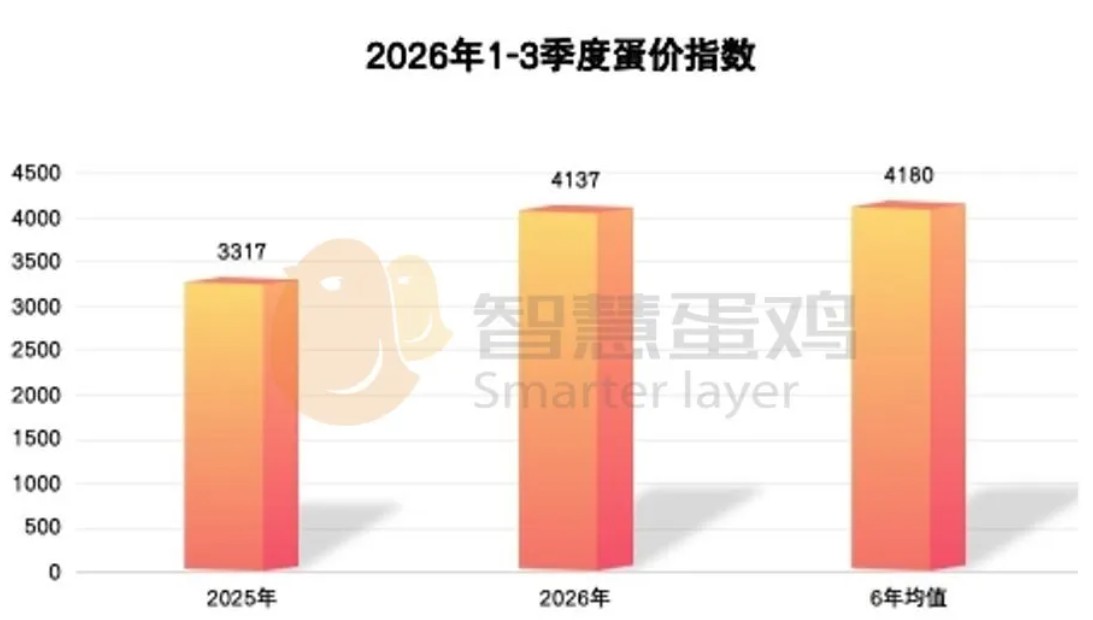
2026Year1-3Quarter, the national average egg price index was4137points, up from the same period last year at3317points, an increase of820points, representing an increase of24.7%; relatively recent6average egg price index for the same period of the year4180points, down by43points, a decrease of1.0%In terms of year-on-year changes, egg prices have recovered significantly compared with the same period last year and have basically returned to the historical average range of the past six years.
2, egg price index positioning analysis
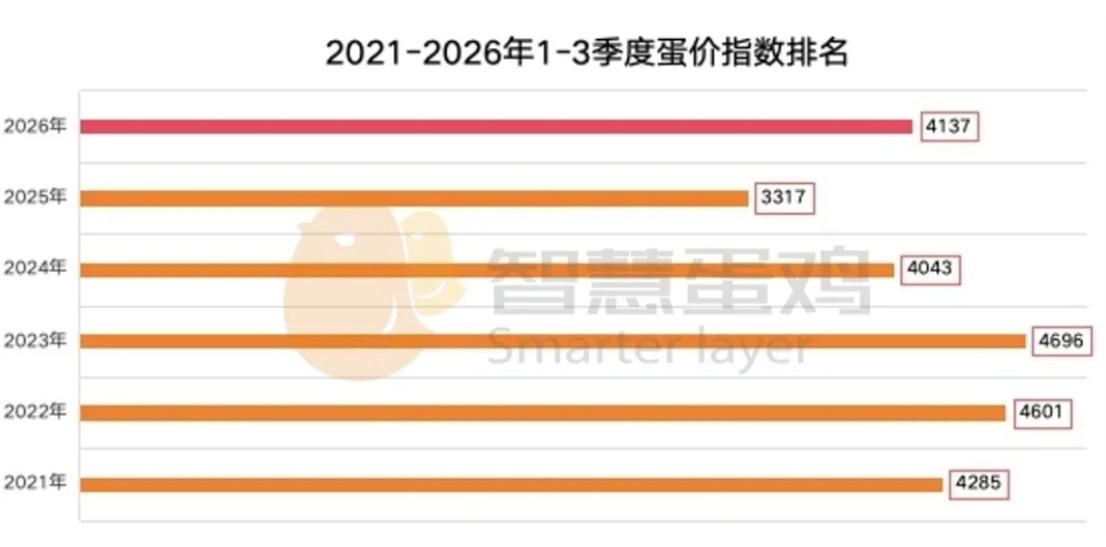
Compared with the past six years’1-3quarterly egg price index, 2026Year1-3The quarterly egg price index was in the low range, ranking third lowest over the past six years. This ranking reflects how, despite a sluggish performance in the first quarter, sustained strengthening in the second and third quarters lifted the overall average, bringing the annual average close to the level for the same period in the past six years.
3、Analysis of Historical Patterns in the Egg Price Index
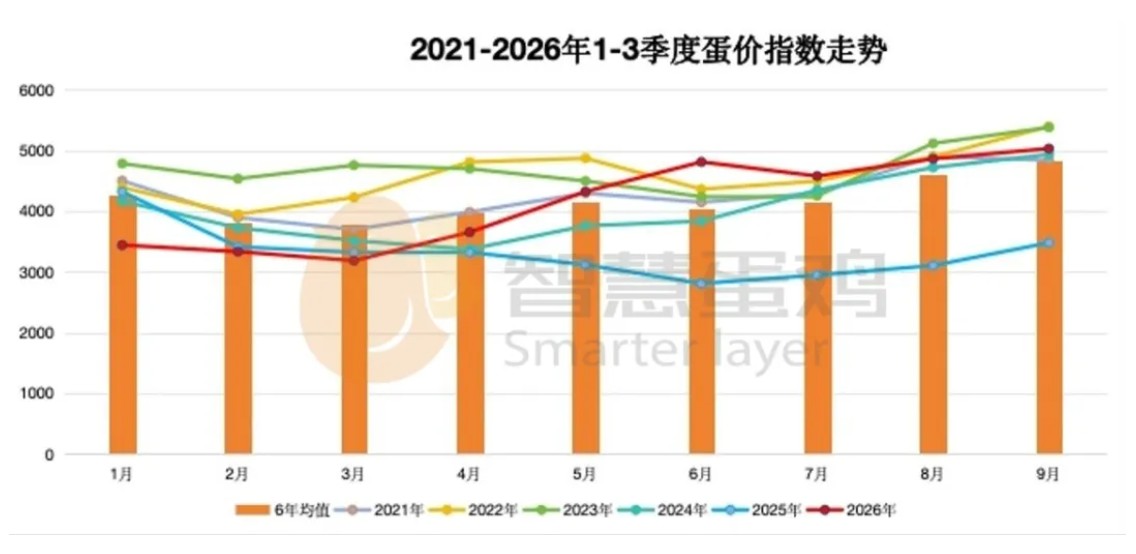
2026year1-3The quarterly egg price index trend was broadly consistent with the monthly egg price index trends for the same period over the past six years, but2026year2Egg prices in the quarter rose more than expected, breaking the historical pattern of the lowest egg prices in the second quarter. In the third quarter, egg prices remained high amid holiday stockpiling and tight supply.
II、Cost Index Analysis
1、Year-on-Year Cost Index Analysis
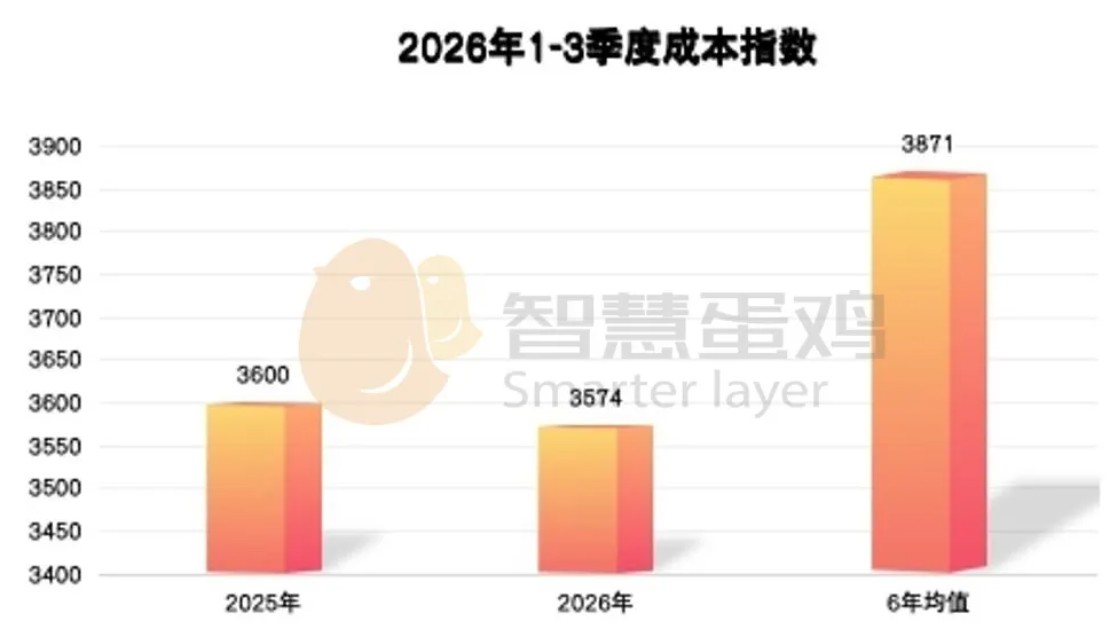
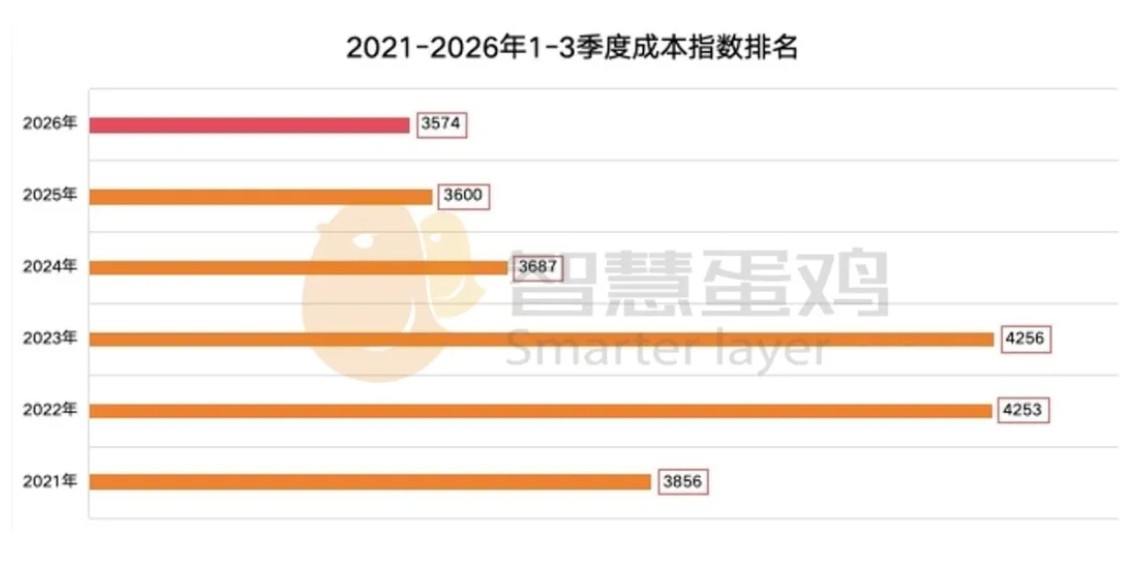
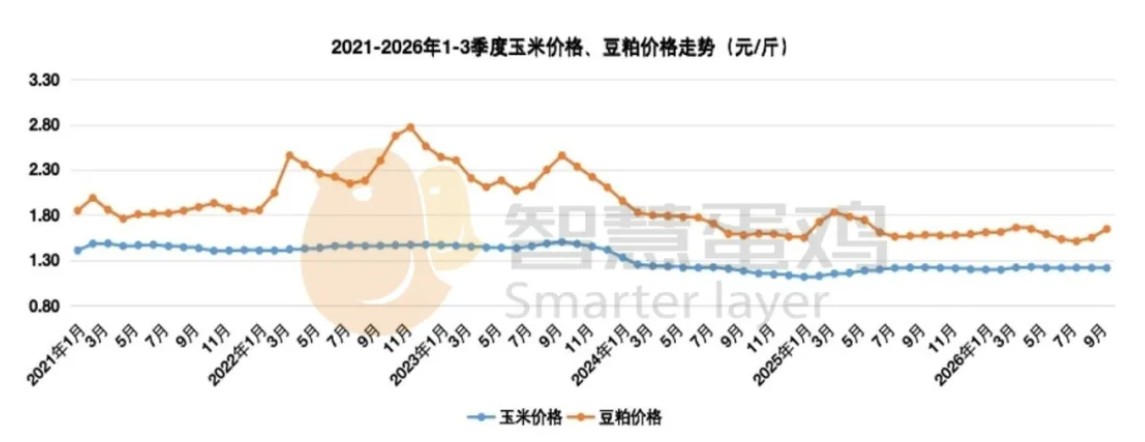
2026Year1-3Quarter, the national average cost index was3574 points, compared with the same period last year,3600 points, down by26 points, a decrease of0.7%; compared with the recent6Average cost index for the same period3871points, down297points, a decrease of7.7%. Costs have remained low for an extended period and have fallen significantly compared with the average over the past six years, creating extremely favorable conditions for a turnaround in profitability in the layer farming industry.
2、Cost index positioning analysis
Compared with the past six years1-3quarterly cost index comparison,2026year1-3The quarterly cost index is at a low level, reaching its lowest point in nearly six years.
3、Analysis of Historical Cost Index Patterns
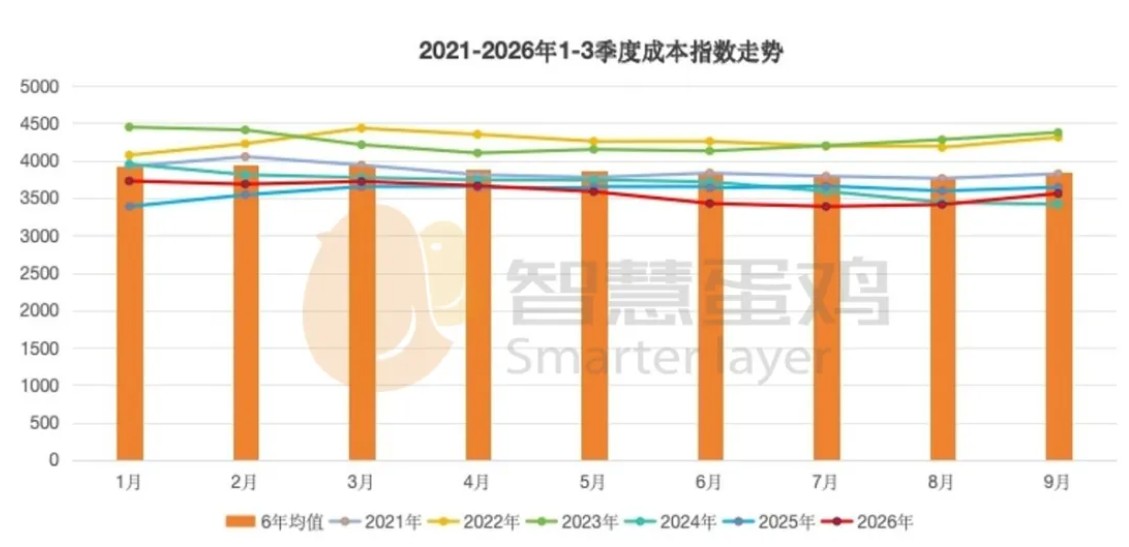
2026year1-3In the quarter, the cost index generally showed a downward trend followed by an upward trend,1-2The quarter saw continued slight fluctuations and a downward trend; in the third quarter, the index fluctuated slightly upward. The cost index in each month was significantly below the average for the same period over the past six years.
III. Profitability Index Analysis
1, Year-on-Year Analysis of the Profitability Index
2026year1-3quarter, the national average profitability index was 562 points, up from -284 points in the same period last year, an increase of 846 points, an increase of297.9%; compared with the recent6year-over-year average profitability index309 points, rising by253 points, an increase of81.8%. From 2025 deep losses for the full year to 2026 strong profits in the first three quarters, the profit turnaround was extremely significant, and the industry's average profitability had significantly exceeded the historical average for the same period.
2, Profitability Index Positioning Analysis
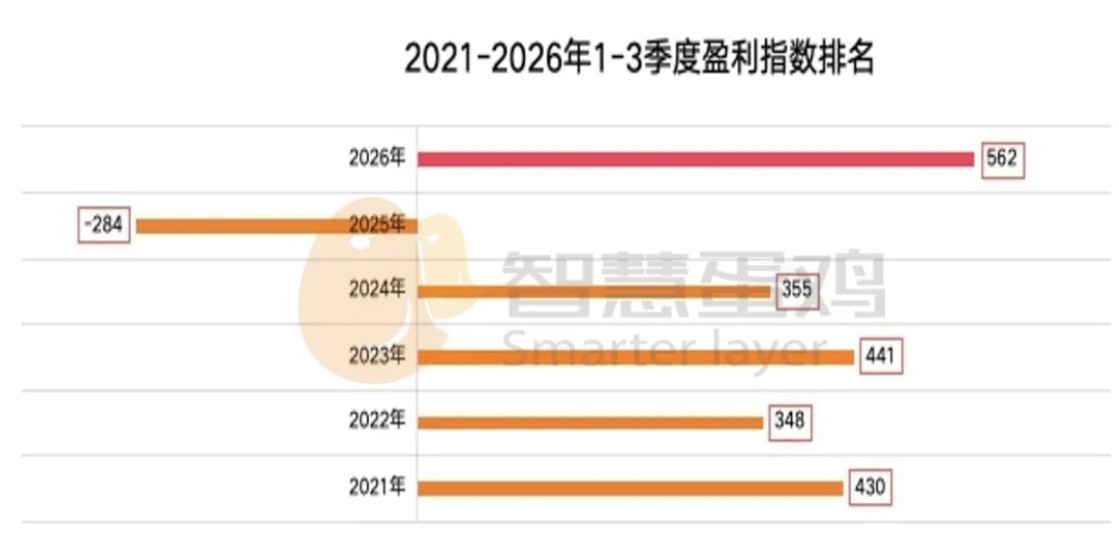
Compared with the past six years1-3quarterly profitability index comparison,2026year1-3The quarterly profitability index is at a high level, reaching its highest point in nearly six years.
3Analysis of historical patterns in the profitability index
2026year1-3The overall trend in the quarterly profitability index is broadly consistent with the average monthly profitability index for the same period over the past six years. However, the rebound in the second quarter exceeded expectations, and, combined with the sustained high level in the third quarter, this brought profitability above the level for the same period over the past six years.
Part two: Analysis of the causes of the egg-laying chicken market
Under normal circumstances, China's egg-laying chicken market is mainly driven by the industry cycle (affecting supply) and the seasonal cycle (affecting demand), while also being influenced by external factors such as feed ingredient prices, the market for substitutes, the macroeconomy, and the policy environment.
I. Supply-side analysis
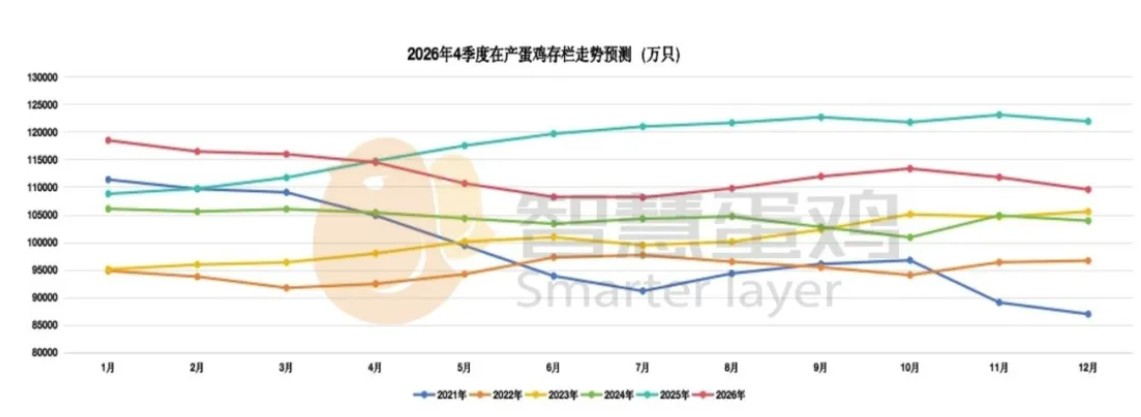
2026year1-3quarter, the national average monthly inventory (theoretical value) of commercial-layer chickens in production11.26hundred million units, compared with the same period last year at11.63hundred million units, a decrease of0.37hundred million units, a decline of3.19%, compared with the average monthly inventory for the same period over the past six years10.47hundred million units, up0.79hundred million units, an increase of7.58%. Year over year, inventories have declined; compared with the same period over the past six years, they remain at a historically high level, but are already lower than 2025 year 9 Monthly peak (12.26 hundred million units) cumulative absorption exceeded 1 hundred million units.
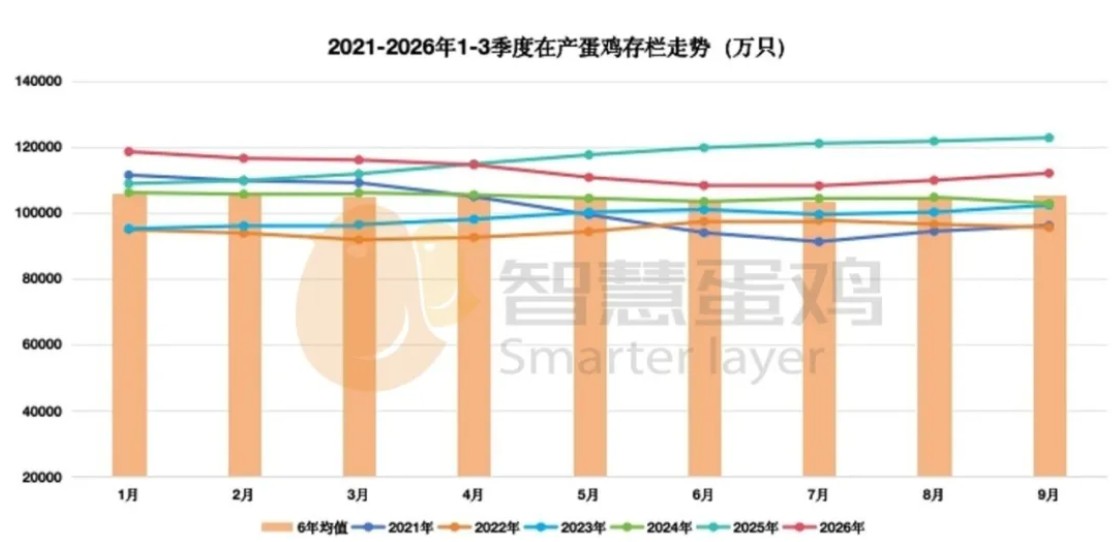
Looking at the monthly trend,1-3The overall number of laying hens in production showed a downward trend during the quarter.The decline was more pronounced in the second quarter. In the third quarter, sustained high profitability led to an increase in the extension of older hens' laying periods, and2026The renewal volume of commercial chicks recovered somewhat in the first quarter, and the combined effect of an increase in new production led to a slight rise in the number of laying hens in production.
II. Consumer-side analysis
Affected by consumption habits and holidays, fresh egg consumption in China has distinct peak and off-peak seasons. Historical data show that,1-2The quarter is the off-season for fresh egg consumption, while3-4the quarter is the peak season for fresh egg consumption.
2026 The seasonal consumption patterns of egg prices have taken on new characteristics. After the Spring Festival 2-3 month, the market enters the traditional off-season for consumption, compounded by the effect of demand being brought forward before the holiday,1-3 Egg prices continued to fall month by month,3 The month reached the lowest point of the year.4 Starting in the month, stockpiling for the Qingming Festival, Labor Day, and Dragon Boat Festival coincided with tight supply, pushing egg prices 6 month to a first-half high.7-9 The month marks the start of the traditional peak season; the Mid-Autumn Festival and National Day""Double Festival""Stockpiling and consumption peaks overlap, and the egg price index continues to rise, reaching a record high for the same period 2022 since, as seasonal consumer demand and industry cycle-driven destocking combine to create a powerful resonance.
Three. Analysis of Other Factors
1、Inventory at every stage is at a historically low level
Market feedback shows,2026year1-3quarter, inventory levels across production and circulation were extremely low. Livestock was sold as soon as it was raised, and the market had almost no buffer stock. This weakened the market’s buffering capacity, making prices highly sensitive to even slight changes in supply and demand and amplifying price volatility. During the period of deep losses in the first quarter, traders and processing companies generally operated with low inventories;2-3During the rapid rebound in egg prices this quarter, all stages of the supply chain were eager to replenish stocks, but supply could not keep up, further driving up egg prices.
2、Impact of Raw Material Prices on the Market
2026 Year 1-3 During the quarter, corn and soybean meal supplies were ample, and prices continued to fall. For corn, market circulation was sufficient after the domestic autumn harvest entered the market, while stable arrivals of imported corn also kept prices generally steady to weak. For soybean meal, prices fluctuated at low levels amid ample global soybean supply and demand and a temporary weakening in demand from the domestic livestock and poultry farming sector. The decline in raw material prices directly reduced feed costs, thereby causing1-3The quarterly average cost index reached a record low2021for the same period since the year, providing core support for a turnaround to profitability.
Part Three: Outlook for the Layer Hen Market
I. Supply-Side Assessment
The layer hen industry cycle is determined by the number of replacement chicks placed in the early period and the inventory of laying hens in production in the later period.2026year1-3quarter, the national monthly average number of commercial chicks placed 9567 ten thousand units, compared with the same period last year at 9727 ten thousand units, a decrease 160 ten thousand units, a decrease of 1.65%; compared with the same period in the past six years 9149 ten thousand units, an increase of 418 ten thousand units, an increase of 4.57%The absolute level of the average monthly placement volume of commercial pullets was lower than the same period last year but higher than the average for the past six years, ranking second highest over the past six years.
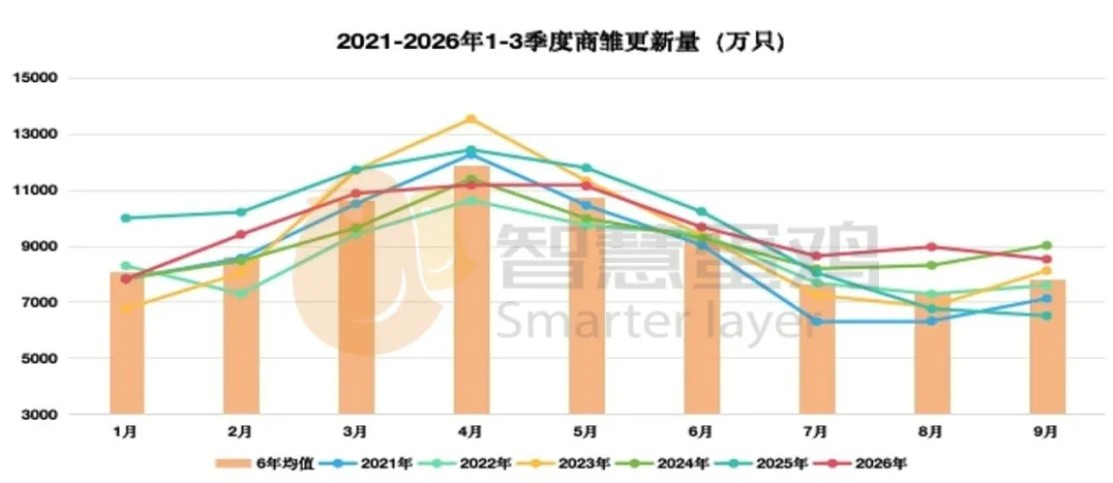
Using the layer market analysis model, the projected laying hen inventory for the subsequent period (theoretical value) can be derived:As the fourth quarter2026year4—6Monthly restockingThe flock is gradually starting to lay, and newly commissioned laying capacity is gradually coming online; based on the culling age of older hens in the fourth quarter540By inference, the average monthly population of laying hens in production in the fourth quarter is estimated at approximately11.15hundred million birds, compared with the third quarterincreased by1617ten thousand units, with an increase of1.5%; decreased compared with the same period last year by10687ten thousand units, a decrease of8.7%; an increase compared with the same period in the most recent six years6772ten thousand units, with an increase of6.5%, the second-highest inventory level for the same period in the past six years.Fresh egg supply was ample in the fourth quarter, providing limited support for egg prices.
II. Demand-side assessment
After fourth-quarter stocking for the two major festivals ends, egg consumption enters a seasonal downturn. End-market sales slow, leaving egg prices without sustained upward momentum and potentially leading to a pullback from high levels.
Three. Impact of feed costs
Regarding feed costs, corn enters its autumn harvest and market-release period in the fourth quarter. Market supply is ample, and corn prices are likely to remain stable to slightly weak. Supply and demand in the soybean meal market are relatively balanced, with no basis for a sharp price rise. Overall combined farming costs are expected to remain within a reasonable range. A low-cost environment will help producers continue to build profits in the fourth quarter. At the same time, potential risks such as extreme weather, changes in grain circulation, and volatility in the international soybean market should be monitored, as they could trigger a temporary rebound in raw material prices and squeeze farming profits.
Four. Overall trend assessment
Based on the supply of fresh eggs and the seasonal demand for fresh eggs, and with reference to historical patterns in the layer market, egg prices in the fourth quarter are highly likely to retreat from their third-quarter highs amid fluctuations, or fluctuate around the break-even point.2026Full-year profit level for the year0.4-0.5yuan/per jin, showing characteristics of middle-aged or somewhat older animals.Although the overall cycle is strong throughout the year, there is still a risk of periodic shifts between profit and loss. Farmers should continue to view market fluctuations rationally and arrange restocking and culling schedules appropriately.
The above data and analysis are for reference only.